Optimizing Performance: Why We Rely on Pyroscope


Julien Richard
CTO and co-founder

Nicolas Girard
Platform Engineer
-
 Copied!
 -
Copied!
-
Copied!


In our pursuit of unified observability, we adopted Pyroscope, an open-source profiling solution, to continuously analyze the performance of our products. This blog post firstly describes how we structured a centralized data flow, from the collection of profiles from all client instances to their visualization in Grafana. Secondly, we explain how this tool has enabled us to optimize the performance of our products.
TL;DR
- We implemented Pyroscope for continuous profiling across all product instances.
- A centralized observability cluster collects profiles, logs, and metrics from distributed Kubernetes environments.
- Grafana integration lets us visualize flame graphs and analyze performance trends over time.
- Profiling helps us detect bottlenecks, optimize code, and ensure high system performance.
- Real-life use case: we identified and resolved CPU-heavy functions in OpenCTI with Pyroscope insights.
What is Profiling ?
Profiling is the process of collecting and analyzing detailed information about how a program consumes resources (such as CPU, memory, or I/O) over time. Unlike traditional metrics, which provide aggregated insights, profiling offers a fine-grained, code-level view of system behavior. It enables teams to pinpoint inefficiencies, bottlenecks, and regressions that are otherwise difficult to detect.
A Centralized Observability Platform
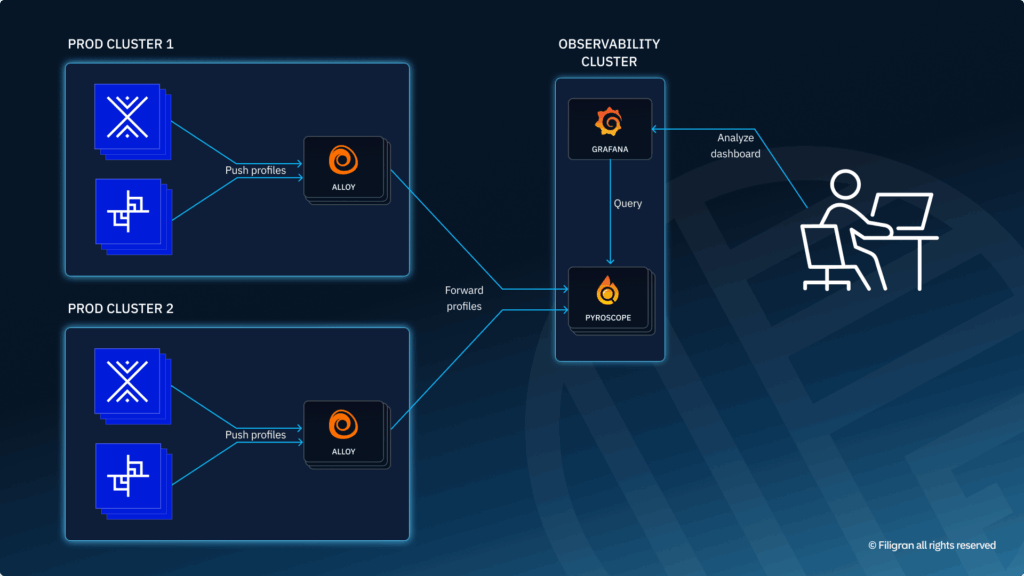
While our products (OpenCTI, OpenBAS) run on Kubernetes clusters distributed across different regions, we have established a single, centralized observability cluster dedicated to collecting and processing all logs, metrics, and profiling data. This centralized approach ensures a consistent, global view of system health without multiplying entry points or increasing maintenance complexity.
Each platform component embeds the Pyroscope Node.js profiling package, which generates profiles at regular intervals and pushes them to Alloy, our unified collector. Deployed across each of our production clusters, Alloy receives the profiling data, applies appropriate labeling, and securely transmits it (via HTTPS and authentication) to the Pyroscope server hosted on the observability cluster. Profiles are retained there for seven days in persistent volumes before being automatically purged.
Visualization and Analysis in Grafana
To make this information actionable, we integrated the Pyroscope plugin into Grafana. Our teams can access flame graphs, compare performance evolution across services, and quickly identify bottlenecks. This seamless integration allows us to guide and prioritize our optimizations as soon as profiling anomalies are detected.
Profiling for your instances
Whether you have a production or development OpenCTI instance, you can now enable profiling on it. Just add:
- A Pyroscope service to your compose deployment:
pyroscope:
	image: grafana/pyroscope
	restart: unless-stopped
	ports:
- "4040:4040"- Environment variables for the OpenCTI process:
APP__TELEMETRY__PYROSCOPE__IDENTIFIER=opencti
APP__TELEMETRY__PYROSCOPE__ENABLED=true
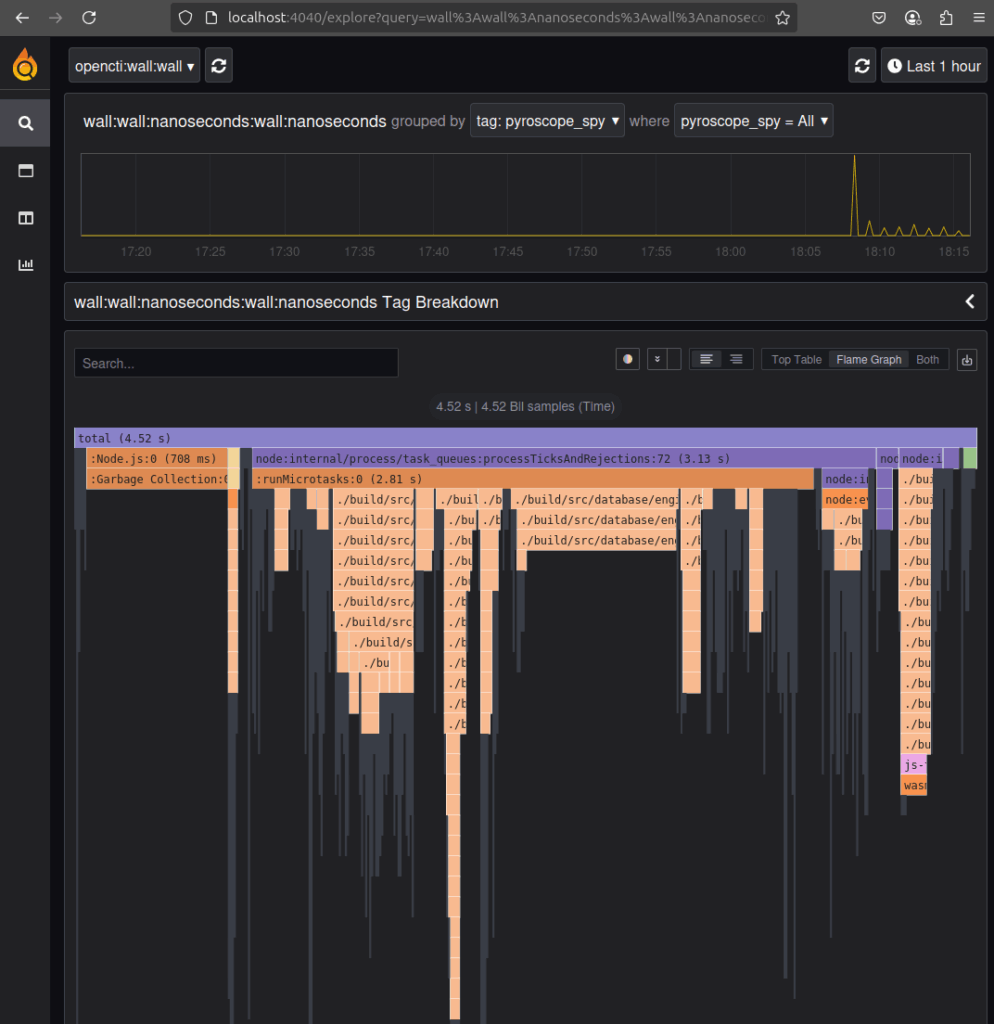
APP__TELEMETRY__PYROSCOPE__EXPORTER="http://docker-pyroscope-1:4040"You should be able to display flames graphs when navigating to localhost:4040:
What is a flame graph and how we use it?
Flame graphs provide an intuitive, hierarchical representation of function calls and their resource consumption (primarily CPU time). The width of each bar in the flame graph indicates the proportion of time spent in that function.
We use this flame graph generated by Pyroscope to:
- Identify CPU Performance Bottlenecks: Pinpoint the exact lines of code consuming the most resources.
- Understand Application Behavior Over Time: Continuous profiling provides a historical view of performance, helping to detect regressions and understand the impact of code changes.
- Identify Abnormal memory consumption: Pinpoint the exact lines of code that retains the most the memory use by the application.
Real life example
Since the implementation of Pyroscope for all our deployments, we have been able to significantly improve the performance of our products. But lets take a real life example to give you a better idea of how we use it recently.
Context for OpenCTI
OpenCTI use nodejs as a backend to process the ingestion load, and nodejs is not a multi thread technology, it’s based on an event loop. You can find more information here https://nodejs.org/en/learn/asynchronous-work/event-loop-timers-and-nexttick.
Due to this architecture, a very important rule must be respected: don’t block the event loop more than 40 ms 😇.
This is a really important rule to follow because blocking the event loop prevents nodejs from correctly executing important chunks and “simulating” multiple operations executing at the same time.
Pyroscope to the rescue
Developing new features in OpenCTI while at the same time respecting this rule can sometimes prove difficult. The product may need to handle very large amounts of data in the same processing function. Imagine a report containing 50,000+ elements that need to be processed in order to validate the data, transform some entries and manipulate the information at multiple levels. At some point you risk creating a function that will block the event loop and will disrupt the overall performance of the platform.
In the case where you deployed the updates in production but did not account for this kind of volumetry in your test procedures, Pyroscope will give you a magic overview of the call stack and the line of code that consume the CPU for a specific range of time.
Unfortunately we don’t keep the screenshots of our last investigations where you can see a specific problem so we will explain an example in a healthy platform.
You can see below an extract of 1 minute monitoring of an OpenCTI.
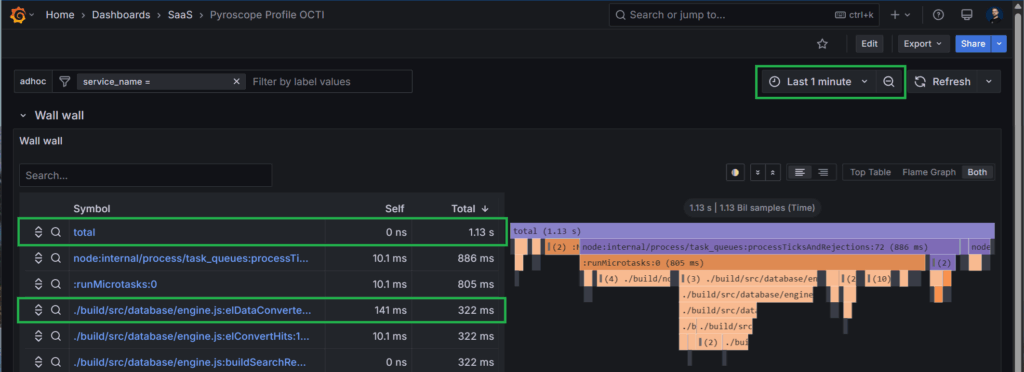
We can learn a lot from it.
- For 1 minute of CPU monitoring, we use only 1.13 seconds of computing time. So the instance is currently chilling 😉
- The function used the most during this period is elDataConverter, that is an internal function of OpenCTI used for parsing data results we fetch in the database.
Click on this function and you will see the call stack position in the graph as well as the line of code which is responsible. In this case, it’s the function definition, as everything inside is processed synchronously.
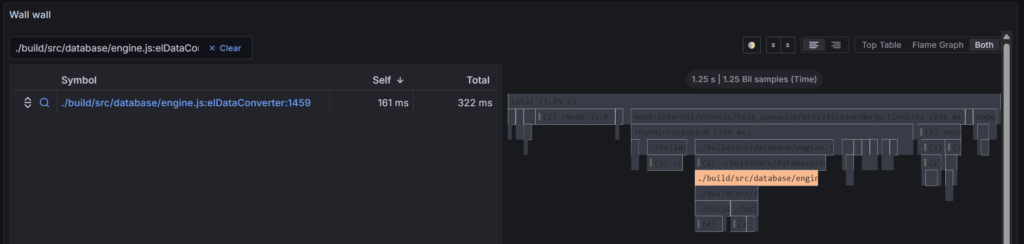
Now imagine Pyroscope is displaying “elDataConverter” function is taking up 55 seconds of CPU out of the last minute. How will this information tell you exactly what to look for and where exactly it could be located in your code? I think you can see the time savings of having this capability directly monitoring your production. 😉
Conclusion
In conclusion, Pyroscope as a profiling solution has been a game-changer in how we monitor and optimize the performance of Filigran products. Leveraging Pyroscope into our centralized observability platform and visualizing data through Grafana, we not only gain detailed insights into resource consumption but also proactively identify and address potential bottlenecks.
This approach has enabled us to maintain high performance standards and make informed decisions regarding product improvements. As a result, we continue to deliver robust and efficient solutions to our clients and community.
If you have any question, request, comment or feedback to share with us, don’t hesitate to join us on Slack!
Read more
Explore related topics and insights


